The corn soybean stocks picture in late 2026 pointed in two different directions: old-crop corn supplies were much larger than a year earlier, while soybean stocks were modestly lower. On September 30, 2026, the USDA National Agricultural Statistics Service reported that old-crop corn stocks in all positions totaled 2.10 billion bushels as of September 1, 2026, up 35% from September 1, 2025; old-crop soybean stocks were down 3% from the prior year USDA grain stocks data.
That split matters because stocks are not just a backward-looking measure of what remains in storage. They shape local basis, storage demand, processor coverage, export expectations, and the way farmers think about sales after harvest. A larger corn carryover can soften urgency among buyers unless demand improves. Lower soybean stocks can support a firmer tone, but only if new-crop production and demand do not offset that signal.
What Corn Soybean Stocks Show
Corn Soybean Stocks In The September Data
The September stocks report gave farmers and market watchers a clear starting point for comparing the two major row crops. Corn entered the new marketing window with a much larger old-crop inventory than the year before. Soybeans did not show the same build. The 3% decline in old-crop soybean stocks was not a severe drawdown, but it still contrasted sharply with the 35% increase in corn.
| Crop | Reported September 1, 2026 Stock Signal | Year-Over-Year Change |
|---|---|---|
| Corn | Old-crop stocks in all positions totaled 2.10 billion bushels | Up 35% |
| Soybeans | Old-crop stocks were lower than a year earlier | Down 3% |
For corn, the larger inventory created a cushion against short-term supply concern. That does not mean prices were guaranteed to weaken, because prices also respond to yield updates, feed demand, ethanol use, export sales, and global competition. Still, a 35% year-over-year increase in old-crop stocks gave the corn market more supply to work through as harvest moved forward.
For soybeans, the lower stocks figure suggested a somewhat tighter old-crop balance. Yet the signal was not strong enough by itself to define the market. Soybeans remain sensitive to processor demand, export pace, and expectations for the size of the crop moving through harvest. The practical reading is that corn soybean stocks were sending a mixed message rather than a simple bullish or bearish signal.
Why Old-Crop Carryover Matters
Old-crop carryover affects the first part of the new marketing year because buyers can draw from grain already in storage while assessing new-crop availability. If elevators, processors, or exporters see ample nearby supply, they may not need to bid as aggressively for immediate delivery. If stocks are tighter, local bids can improve where users need grain quickly.
This relationship is local as well as national. A national corn stock increase does not mean every county has the same storage pressure or basis weakness. Transportation access, river movement, feed demand, ethanol processing, and elevator space can all change the price a farmer sees. That is why community-level reporting and local elevator information remain useful alongside USDA data.
Price Signals After The September WASDE
Corn Yield And Acreage Changes
The September 2026 WASDE outlook added another layer to the stocks discussion. Iowa State University Extension summarized the September outlook showing U.S. 2026/27 season-average farm prices at $4.80 per bushel for corn and $12.00 per bushel for soybeans. The same report noted that harvested area for corn was revised down to 88.5 million acres, a reduction of 100,000 acres, while corn yield was estimated at 178.5 bushels per acre, lowering production by 213 million bushels Iowa State Extension analysis.
Those changes help explain why a large old-crop corn stock number did not settle the market debate. A bigger carryover can weigh on price expectations, but a lower production estimate can tighten the forward balance. Market watchers had to consider both at the same time: more corn left from the old crop, but a smaller production outlook than earlier estimates suggested.
For farmers, that means the headline stock number should not be treated as a full marketing plan. It is one input. Expected yield on the farm, crop insurance position, storage cost, basis, cash flow needs, and local delivery opportunities still shape the decision. A cautious approach is to test how sales plans perform under several price and yield scenarios rather than assuming one national report will define the season.
Soybean Prices Need Demand Confirmation
The soybean side also required restraint in interpretation. A 3% decline in old-crop stocks was supportive compared with corn, but the September price outlook still depended on demand signals. Soybean values are closely tied to crush activity, export demand, and expectations for oil and meal use. The research notes also indicated that market attention included questions around crush rates and harvest pressure, but those details require continued confirmation from official and market data as the marketing year develops.
The key point is that corn soybean stocks should be read with production and use. A lower soybean stock number can lose strength if new-crop production expands faster than demand. A large corn stock number can have less impact if production is cut or demand improves. This balance is why September and early harvest reports often shift market expectations without providing a final answer.
Farm Planning Under Uneven Stock Signals
Storage, Basis, And Cash Flow
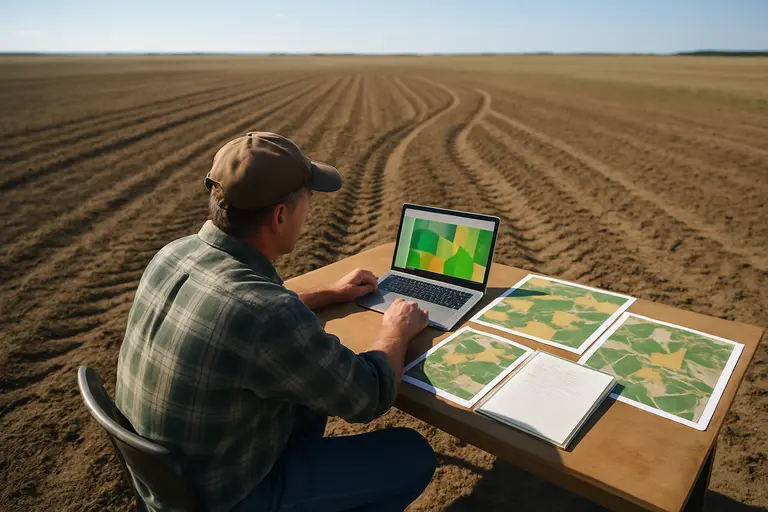
Farm-level planning starts with a question that national data cannot answer alone: does storing grain create a better expected return than selling at harvest? For corn, larger old-crop stocks can raise concern about elevator space and weaker harvest basis in some areas. If many farms carry old-crop grain while new bushels arrive, local storage pressure can increase. The actual outcome depends on local capacity and nearby demand.
For soybeans, the smaller decline in old-crop stocks may provide some support, but farmers still need to compare storage costs with expected basis improvement. Soybeans can move quickly through export and processing channels when demand is strong, yet price pressure can build during harvest if buyers believe supplies are adequate. No single rule fits every farm. Producers should keep records of bids, delivery windows, drying or handling costs, and interest expense before deciding whether to store or sell.
These decisions also connect to sustainability. Storage, transportation, and input choices affect both financial resilience and resource use. A farm that avoids unnecessary hauling, aligns delivery with local demand, and protects soil productivity is better positioned than one reacting only to daily price moves. Sustainable farming is not separate from market planning; it is part of managing risk over more than one crop year.
Community Data Helps Fill Gaps
Local knowledge can improve how producers interpret national data. Farmer groups, extension meetings, cooperatives, and county-level discussions can identify storage stress, harvest delays, or basis changes before they are fully visible in national reports. Clear communication matters here. Community agriculture sites and publishers, including related resources such as Leap Year Publishing Leap Year Publishing, show how plain language and careful sourcing can help readers act on information without overstating what the data can prove.
The most practical community strategy is to combine national numbers with local observation. If a region has strong processor demand, a national stocks increase may have less local impact. If storage is tight and harvest moves quickly, even a neutral national outlook can feel burdensome at the elevator. Farmers who compare both views are less likely to overreact to a single report.
Corn Soybean Stocks And Farm Decisions
The late-2026 data did not point to one simple market story. Corn had a much larger old-crop stock position, with 2.10 billion bushels reported in all positions as of September 1, 2026. Soybeans had a lower old-crop stock position, down 3% from the previous year. At the same time, September supply and price estimates showed why production changes still mattered for the new marketing year.
For market watchers, the main task is to track whether the corn carryover limits price strength or whether lower production estimates tighten the balance enough to support prices. For soybeans, the task is to watch whether demand is strong enough to absorb available supplies without adding pressure during harvest movement.
For farmers, the most grounded response is not prediction but preparation. That means updating yield estimates, knowing storage costs, watching basis, and comparing local bids against realistic cash flow needs. Corn soybean stocks offer a valuable signal, but they work best as part of a wider decision process that includes field results, local demand, and disciplined risk management.