U.S. farm debt has reached a record $605.1 billion in 2026, according to the latest USDA forecast, as producers face weaker inflation-adjusted income, expensive inputs and tighter agricultural credit conditions. But the official figure may not capture the full amount farmers actually owe.
A Reuters investigation published October 8 found that farmers are increasingly relying on credit from equipment dealers, agricultural suppliers, cooperatives, fintech companies and other nontraditional lenders. Some of these obligations are difficult to capture through conventional USDA data collection, creating a potentially important gap between measured farm debt and the financial commitments carried by agricultural operations.
The issue is emerging at a difficult point in the farm cycle. USDA expects 2026 net farm income to decline 5.5% after inflation, while total farm debt is projected to increase 1.5% in inflation-adjusted terms. The combination means debt is growing at a time when the purchasing power of farm profits is weakening. (USDA farm debt and wealth data)
Farm Debt Has More Than Doubled Since 2000
The scale of agricultural borrowing has changed considerably over the past quarter century.
USDA’s Economic Research Service forecasts total U.S. farm-sector debt at $605.1 billion in 2026, an increase of $26.4 billion, or 4.6%, from 2025. Farm real estate debt is expected to reach $399.0 billion, while non-real-estate debt is projected at $206.1 billion.
Reuters reported October 8 that the $605 billion figure is more than double the level recorded in 2000. The increase reflects decades of higher land values, larger machinery investments, rising production costs and greater capital requirements across commercial agriculture.
The increase in debt by itself does not mean that the farm sector is facing a broad financial crisis. Farm assets are also extremely valuable. USDA forecasts total farm-sector assets of $4.47 trillion in 2026, including approximately $3.72 trillion in farm real estate.
That produces a projected debt-to-asset ratio of roughly 13.5%, a relatively low level compared with many other industries.
The problem is that balance-sheet strength can conceal cash-flow pressure.
A farmer can own valuable land while struggling to generate enough annual cash to pay operating loans, machinery notes, fertilizer bills, fuel costs and other obligations. This distinction becomes especially important when land values remain strong while commodity margins weaken.
Alternative Credit Is Becoming A Larger Part Of Farm Financing
Traditional farm lending has historically centered on commercial banks, Farm Credit institutions and USDA programs. But the financing landscape is becoming more fragmented.
Reuters found that farmers are increasingly turning to agricultural suppliers, equipment dealers, cooperatives and fintech companies for credit as conventional lenders become more cautious about agricultural risk.
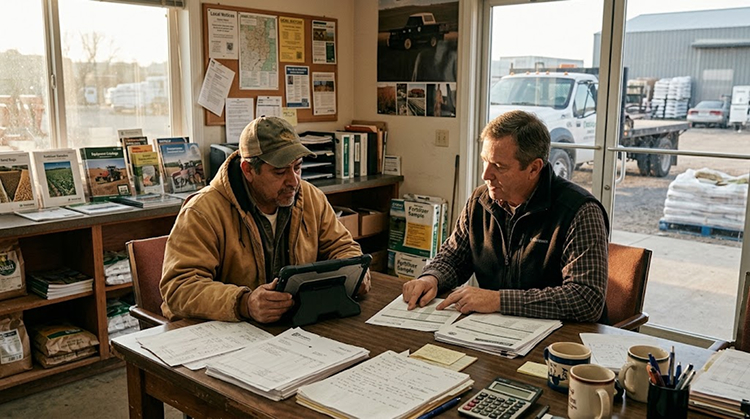
One of the clearest examples is Land O’Lakes, which expanded its loan commitments from approximately $100 million to more than $1 billion within a year, according to the Reuters investigation. The expansion illustrates how agricultural businesses that historically operated primarily within the supply chain can become significant sources of producer financing.
This type of credit can be attractive because it is closely connected to the farmer’s immediate business needs. A supplier may finance seed, fertilizer or crop-protection products. An equipment dealer may offer financing tied directly to machinery. A cooperative may extend credit based on a producer’s expected crop sales.
The arrangement can provide working capital when a conventional lender declines to increase an operating line.
But it can also make the overall financial picture harder to measure.
A farm might have a bank operating loan, an equipment loan, supplier financing and a cooperative credit balance simultaneously. Each obligation may appear reasonable in isolation, while the combined repayment schedule creates significantly greater pressure on seasonal cash flow. (Reuters investigation into U.S. farm debt)
USDA’s Debt Number May Not Capture Every Liability
The central issue raised by the Reuters investigation is measurement.
USDA’s farm-sector balance sheet is designed to provide a comprehensive picture of agricultural assets and liabilities, but researchers and government officials are examining whether changes in farm financing are making some forms of debt harder to capture.
Lower response rates to government surveys are one concern. Another involves obligations recorded through equipment liens and other financing arrangements that may not appear in conventional agricultural debt statistics.
That does not mean the USDA’s $605.1 billion estimate is incorrect. It means the number should be understood as an official estimate based on available data rather than a perfect accounting of every financial obligation attached to U.S. agriculture.
The distinction is becoming more relevant as financing moves outside traditional banking channels.
USDA has begun research aimed at improving its understanding of alternative farm credit. Reuters reported that researchers expect the work to take approximately two years.
For policymakers, the quality of this information matters because farm debt influences credit availability, equipment investment, land purchases and the ability of producers to absorb a bad harvest.
For farmers, the more immediate concern is simpler: how much cash must leave the operation each month or year to service every obligation?
Farm Income Is Moving In The Opposite Direction
Debt becomes more difficult to manage when income growth fails to keep pace.
USDA’s September 3 forecast places 2026 net farm income at $158.4 billion, down $4.3 billion, or 2.6%, from 2025 in nominal terms. After adjusting for inflation, the decline is $9.1 billion, or 5.5%.
Net cash farm income is forecast at $176.4 billion, just 0.4% higher than 2025 in nominal terms. After inflation, it is expected to fall 2.5%.
That creates an important contrast with the debt numbers. Farm debt is increasing substantially in nominal terms while inflation-adjusted farm income is declining.
USDA also expects total inflation-adjusted farm cash receipts to fall by $18.0 billion, or 3.2%, to $540.3 billion in 2026. Crop receipts provide some support, with inflation-adjusted crop cash receipts projected to rise, but animal and animal-product receipts are forecast to fall sharply.
That creates different financial conditions across commodities.
A soybean producer benefiting from stronger prices may have a different cash-flow position from a livestock producer facing weaker margins. A grain farmer with substantial land equity may also have a different borrowing capacity from a younger operator renting most of the acreage.
The national debt figure therefore needs to be viewed as an aggregate indicator rather than a description of every farm’s financial condition.
Higher Input Costs Are Increasing Working-Capital Needs
Farm borrowing is closely tied to the cost of producing the next crop.
Seed, fertilizer, crop protection, fuel, repairs, machinery, land rent and labor all require capital before a farmer receives revenue from the crop. That creates a seasonal financing gap that operating loans are designed to bridge.
When those expenses increase, producers can require larger credit lines even if acreage and expected production remain unchanged.
USDA projects 2026 farm production expenses at levels comparable to 2025, with inflation-adjusted expenses increasing about 1.5%, or $7.1 billion. At the same time, geopolitical disruptions have contributed to higher energy and fertilizer costs, adding pressure to farm operating budgets.
This is where alternative financing can become attractive.
A producer may have sufficient land equity but limited cash available before planting or harvest. A supplier willing to finance fertilizer or seed can effectively extend the farm’s working-capital runway.
The benefit is immediate liquidity.
The cost is that the farm accumulates another financial obligation that must eventually be paid from crop or livestock revenue.
That makes farm financial planning increasingly important as producers compare the cost of traditional loans with supplier financing, machinery credit and other alternatives.
October FSA Rates Show The Cost Of Conventional Borrowing
USDA’s Farm Service Agency provides another reference point for the current credit environment.
For October 2026, the FSA set its direct farm operating loan rate at 5.375% and its direct farm ownership loan rate at 6.250%. Joint-financing ownership loans were set at 4.250%, while down-payment ownership loans were set at 2.250%. (USDA October 2026 agricultural lending rates)
Commodity loans with terms of less than one year carried a 5.250% rate. Farm Storage Facility Loan rates ranged from 4.500% for three-year terms to 5.000% for 12-year terms.
These rates are important because operating credit can represent millions of dollars across the commercial farm sector.
Consider a simplified $500,000 operating balance at 5.375%. If the full amount remained outstanding for an entire year, the interest expense would be approximately $26,875 before fees or changes in the balance. Actual farm borrowing typically fluctuates throughout the production cycle, so the calculation is only an illustration.
The broader point is that even moderate changes in interest rates can materially affect production budgets when farms operate with large credit lines.
Agricultural Banks Are Reporting Tighter Credit Conditions
The pressure is also visible in regional Federal Reserve agricultural-credit surveys.
The Federal Reserve Bank of Kansas City reported in August that agricultural credit conditions continued to deteriorate gradually during the second quarter of 2026. Farm incomes remained subdued, while lenders reported steadily tighter credit conditions. Financial conditions were weaker for smaller farms and operations that were majority renters. (Kansas City Fed agricultural credit survey)
The Federal Reserve Bank of Minneapolis reported similar concerns earlier in 2026. More than 75% of agricultural lenders surveyed in its district said farm incomes declined during the first quarter compared with a year earlier.
Loan demand was also increasing. Forty-six percent of respondents reported higher demand for loans, compared with 13% reporting lower demand. Almost half of lenders said loan renewals or extensions had increased, while 24% of banks reported increasing collateral requirements.
These figures provide important context for the rise of alternative credit.
When farmers need more financing at the same time that banks become more cautious, another lender can fill the gap.
The financing does not disappear because a bank declines it. It can simply move somewhere else.
Smaller Farms May Face Greater Financing Pressure
Credit tightening does not affect every agricultural operation equally.
Large farms often have diversified assets, established banking relationships and significant collateral. Smaller farms and operations that rent a large percentage of their land can have fewer options.
The Kansas City Fed specifically reported weaker financial conditions among smaller farms and farms that are majority renters.
That matters because rented acreage creates a different balance-sheet structure. A farmer may operate thousands of acres without owning the underlying land, meaning the operation generates substantial annual revenue but has less real-estate equity available as collateral.
If crop margins fall, the producer may still need to finance seed, fertilizer, fuel and rent for the following season.
Alternative credit can become particularly important under those conditions.
However, supplier or dealer financing may carry different repayment schedules, collateral arrangements and pricing structures from conventional agricultural loans. Producers therefore need to evaluate the full cost and timing of every credit source rather than focusing solely on the headline interest rate.
Equipment Financing Adds Another Layer Of Debt
Machinery is one of the largest capital requirements in modern agriculture.
Combines, tractors, sprayers, planters and grain-handling equipment can each require substantial financing. The equipment may increase productivity and reduce labor requirements, but the associated debt can remain on the farm balance sheet for years.
A farmer who finances a $500,000 combine, for example, does not simply acquire a machine. The operation also acquires a scheduled payment obligation that must be supported by future production.
That creates a timing issue.
The equipment may increase productive capacity over several seasons, while loan payments begin much sooner. If commodity prices decline after the purchase, the equipment remains fixed while revenue becomes less certain.
This is one reason the growth of alternative financing deserves attention. Equipment dealers can become lenders as well as sellers, allowing producers to acquire machinery even when traditional credit becomes harder to obtain.
The arrangement can be economically sensible when the equipment generates enough additional income or savings to justify the financing cost.
It becomes more dangerous when producers use debt to maintain machinery purchases that their current cash flow cannot comfortably support.
Land Values Are Supporting Farm Balance Sheets
There is also a reason why the current farm-debt situation looks different from a classic balance-sheet crisis.
Farm assets remain extremely valuable.

USDA forecasts total farm-sector assets at $4.47 trillion in 2026, with farm real estate accounting for approximately $3.72 trillion. Real estate represents about 83% of total farm-sector assets.
Farm-sector equity is projected at $3.86 trillion, up 2.7% nominally from 2025.
That provides substantial collateral across the agricultural economy.
But asset value and liquidity are different things.
A farm worth several million dollars cannot necessarily sell a portion of its land quickly enough to cover a fertilizer bill or machinery payment without disrupting the operation. Land also represents the productive foundation of the business, so selling it can reduce future earning capacity.
Strong land values therefore protect farm balance sheets while doing little to solve every short-term cash-flow problem.
This is one of the most important distinctions in interpreting the current debt numbers.
Hidden Credit Could Make Agricultural Risk Harder To Measure
The most important question raised by the latest Reuters investigation is whether agricultural policymakers have enough information to see the entire credit structure.
If a farm has $2 million in conventional bank debt and another $1 million in supplier, equipment and cooperative obligations, the farm’s financial exposure is closer to $3 million than $2 million.
If those alternative obligations are not captured consistently in national statistics, policymakers could underestimate the amount of leverage carried by portions of the farm sector.
That does not mean a systemic agricultural crisis is inevitable.
It means the warning signals could become harder to interpret.
USDA officials and researchers cited by Reuters are studying the issue because hidden liabilities could become more significant if commodity prices remain weak, input costs rise or credit conditions tighten further.
The research is expected to take about two years, which means better national data will not arrive immediately.
In the meantime, banks, suppliers and agricultural businesses are making lending decisions with their own information about individual producers.
The 2026 Farm Economy Has A Narrower Margin For Error
The combination of record official debt, weaker inflation-adjusted farm income and tighter credit conditions creates a more complicated financial environment for U.S. agriculture.
The sector still has considerable financial strength. Farm assets are worth trillions of dollars, equity remains high and USDA expects average net cash farm income for qualifying farm businesses to rise 7.1% nominally to $121,700 in 2026.
But aggregate averages can hide substantial differences between operations.
A producer with strong crop yields, manageable land debt and favorable basis may be in a healthy position. Another producer facing high rent, expensive machinery, weaker commodity prices and multiple credit lines can experience much greater financial stress.
The growth of alternative credit adds another variable.
Farmers have more potential sources of capital than they did when agricultural financing was dominated by conventional banks and government programs. That flexibility can help keep farms operating through difficult periods.
It can also make total leverage harder to see.
The challenge for the agricultural economy is therefore becoming less about whether farmers can find credit and more about how much credit they need, where that credit comes from and whether future farm income can support it.
The $605.1 billion official debt forecast gives the industry a clear benchmark. The rapid expansion of nontraditional financing suggests the actual financial picture may be broader.
As USDA works to improve its measurement of alternative agricultural credit, farmers, lenders and suppliers will be watching the same fundamental indicators: commodity prices, input costs, interest rates, land values and the cash available after each production cycle.
Those factors will determine whether record farm debt remains a manageable feature of a capital-intensive agricultural economy or becomes a larger constraint on farm investment and consolidation.